Monitoring
Components overview
Pergola shows detailed information about all Components running on a Stage.
Navigate to your Project on the start page or under the 'Projects' navigation. Click on the Stage you want to see your Components for:
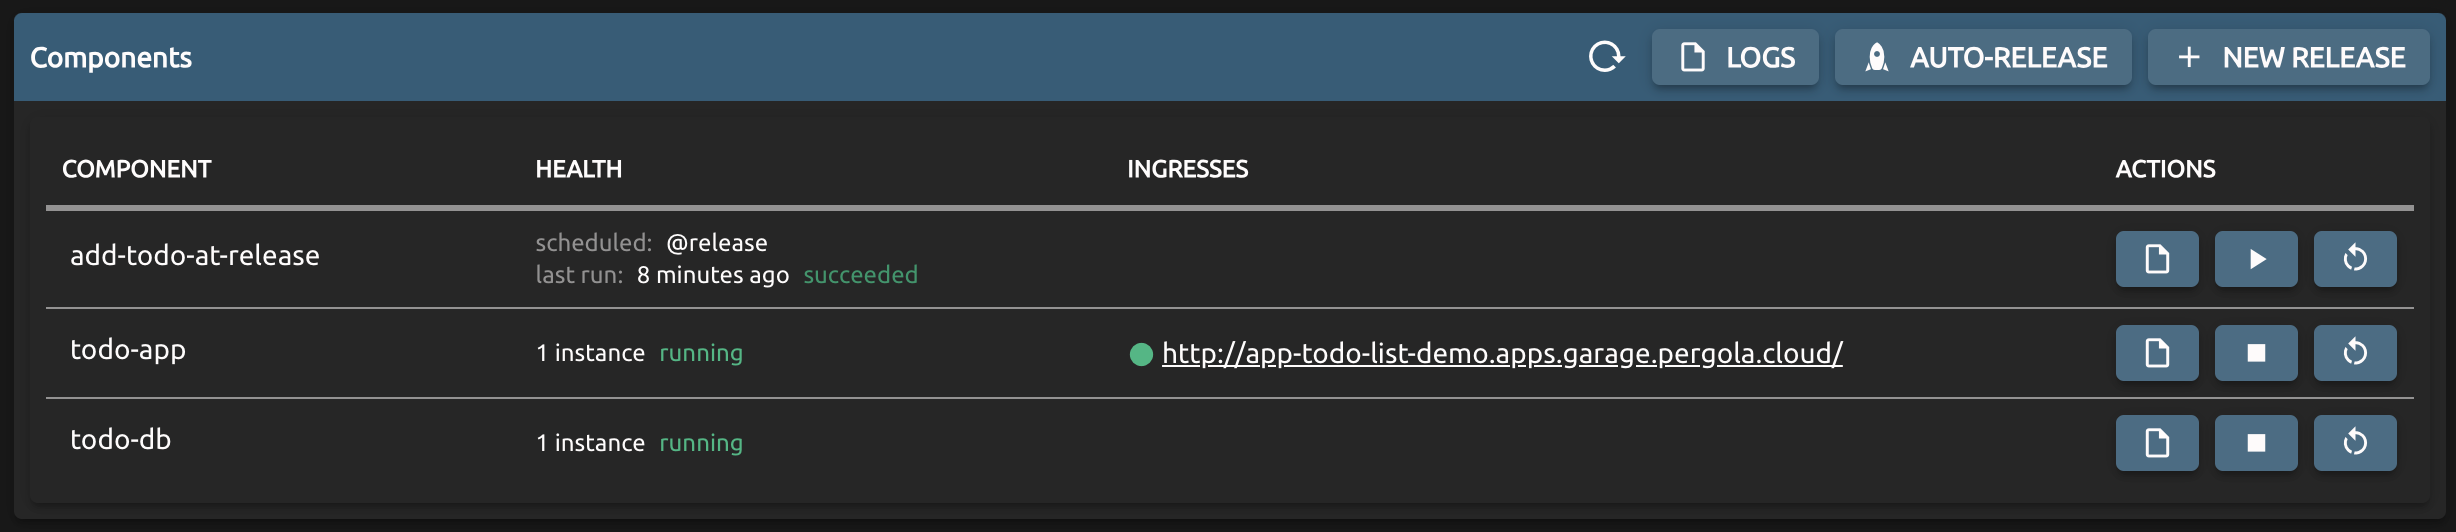
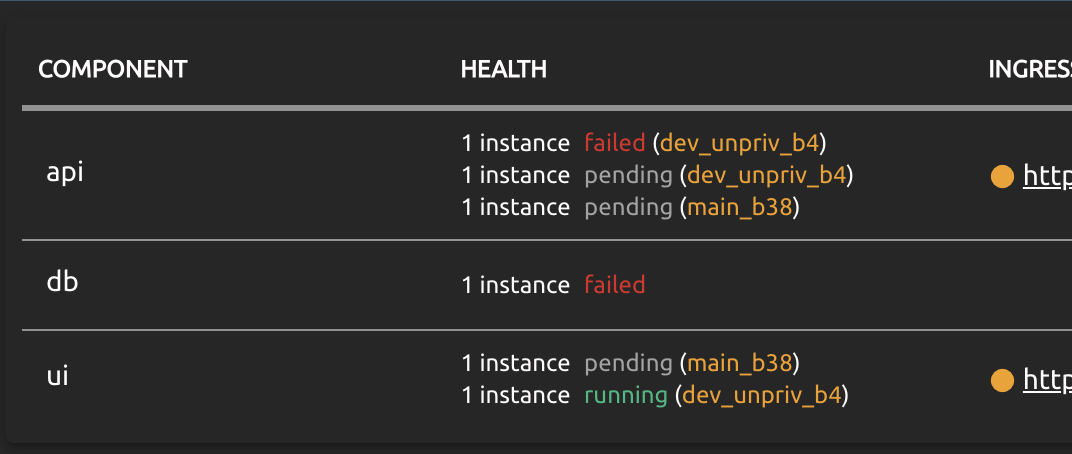
You can check the number of running instances, job execution states, web endpoints (ingresses) and potential failures. Here is an example with some problems:
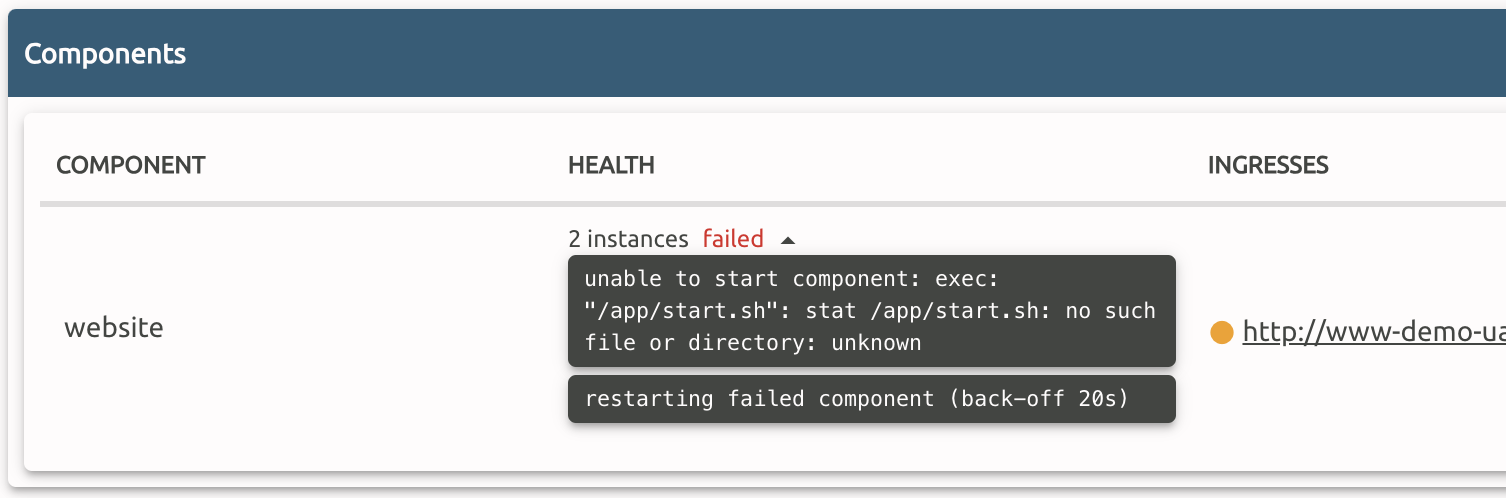
If there are more details available for a failed Component, you'll see a small expand icon next to the affected instance, you can click for additional info:
Logging
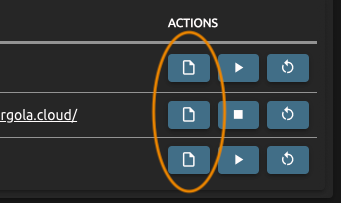
In order to access your application logs, click the logs button next to each Component to see its runtime logs:
This will open the logs of your Component as produced by your application:
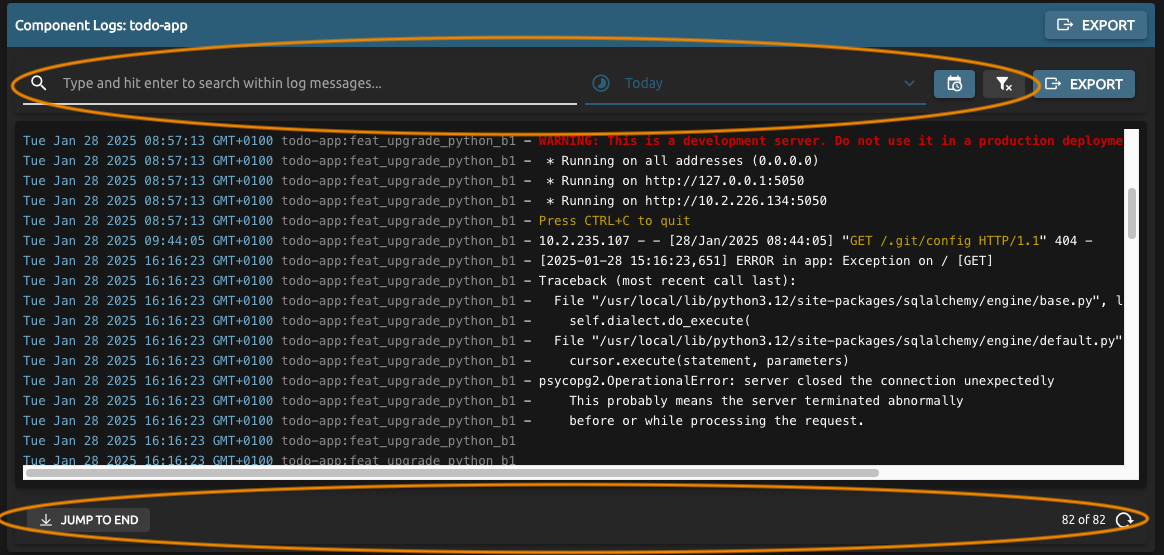
The upper toolbar allows you to select a specific time frame and filter for messages. The bottom toolbar helps you to navigate large logs.